How much is Japan's export to India worth?
Solution
Japan's exports to India = India's imports from Japan billion USD.
Answer: (C) 7.0 Billion USD
Bar, line, scatter and other charts to read and calculate from.
Appeared in 11 of 18 slots. Most recent: CAT 2025 Slot 1.
| Year | Slot 1 | Slot 2 | Slot 3 | Sets |
|---|---|---|---|---|
| CAT 2025 | 1 | 2 | 1 | 4 |
| CAT 2024 | 1 | 2 | 1 | 4 |
| CAT 2023 | 0 | 0 | 0 | 0 |
| CAT 2022 | 0 | 1 | 1 | 2 |
| CAT 2021 | 1 | 1 | 1 | 3 |
| CAT 2020 | 0 | 0 | 0 | 0 |
| Total | 3 | 6 | 4 | 13 |
Five countries engage in trade with each other. Each country levies import tariffs on the other countries. The import tariff levied by Country X on Country Y is calculated by multiplying the corresponding tariff percentage with the total imports of Country X from Country Y.
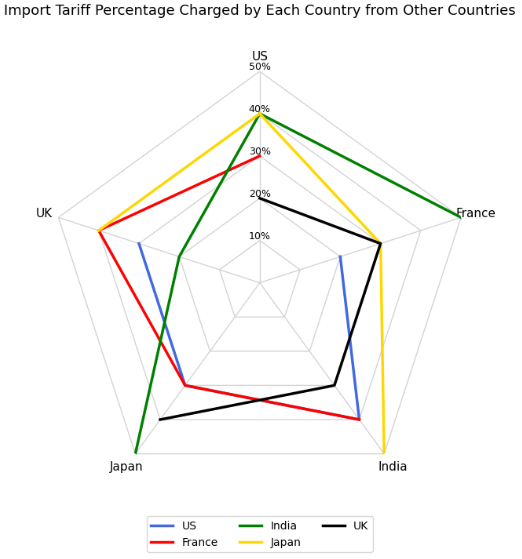
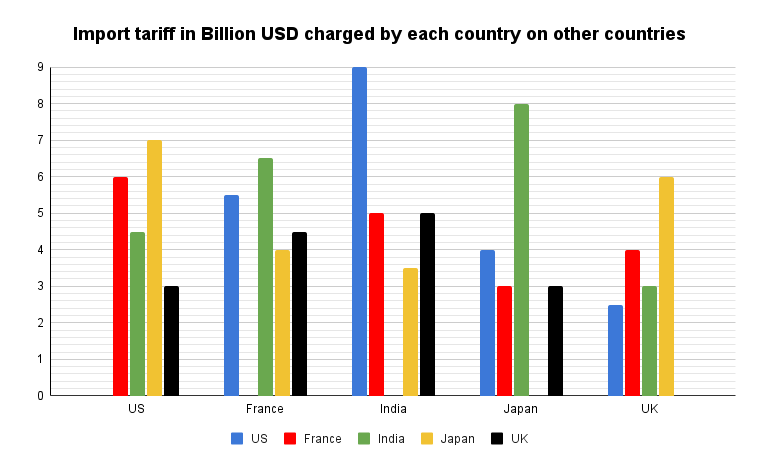
The radar chart below depicts different import tariff percentages charged by each of the five countries on the others. For example, US (the blue line in the chart) charges 20%, 40%, 30%, and 30% import tariff percentages on imports from France, India, Japan, and UK, respectively. The bar chart depicts the import tariffs levied by each county on other countries. For example, US charged import tariff of 3 billion USD on UK.
Assume that imports from one country to another equals the exports from the latter to the former.
The trade surplus of Country X with Country Y is defined as follows.
Trade surplus = Exports from Country X to Country Y - Imports to Country X from Country Y.
A negative trade surplus is called trade deficit.
Imports of X from Y . Exports of Y to X are the same number.
Read the percentages from the radar chart (each country's line) and the tariff amounts from the bar chart (grouped by the country charging the tariff).
How much is Japan's export to India worth?
Japan's exports to India = India's imports from Japan billion USD.
Which among the following is the highest?
A: UK imports from Japan . B: US imports from France . C: Japan imports from France . D: France imports from India .
Highest: imports by US from France.
What is the trade surplus/trade deficit of India with UK?
India's exports to UK = UK's imports from India . India's imports from UK .
Trade surplus : a deficit of 15.0 billion USD.
Among France and UK, who has/have trade surplus(es) with US?
France: exports to US , imports from US , so a surplus.
UK: exports to US , imports from US , so a deficit.
Only France.
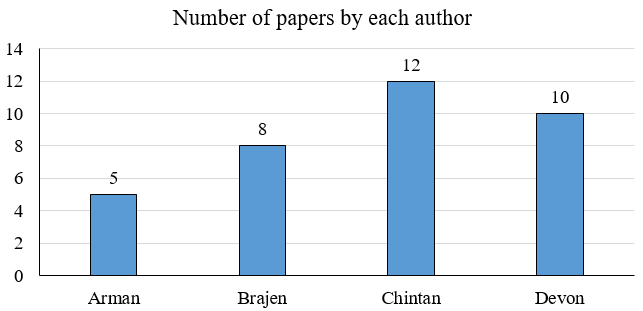
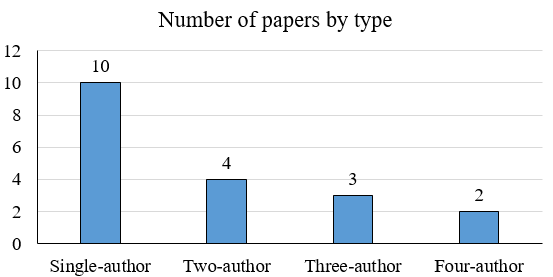
The following charts depict details of research papers written by four authors, Arman, Brajen, Chintan, and Devon. The papers were of four types, single-author, two-author, three-author, and four-author, that is, written by one, two, three, or all four of these authors, respectively. No other authors were involved in writing these papers.
The following additional facts are known.
1. Each of the authors wrote at least one of each of the four types of papers.
2. The four authors wrote different numbers of single-author papers.
3. Both Chintan and Devon wrote more three-author papers than Brajen.
4. The number of single-author and two-author papers written by Brajen were the same.
Papers: 10 single, 4 two-author, 3 three-author, 2 four-author. Author totals: Arman 5, Brajen 8, Chintan 12, Devon 10.
Every author is on both four-author papers. Brajen: singles two-author, so ; three-author must be even, so Brajen has 2 of each type.
Chintan and Devon wrote more three-author papers than Brajen, so 3 each, and Arman 1 (total incidences 9).
Three-author papers: , , .
Singles are distinct and sum to 10: . Arman: , so 1 single and 1 two-author paper. Brajen has 2 singles, so Chintan and Devon have 3 and 4.
Two-author incidences : .
Case 1: Chintan 3 singles, 4 two-author; Devon 4 singles, 1 two-author.
Case 2: Chintan 4 singles, 3 two-author; Devon 3 singles, 2 two-author.
What was the total number of two-author and three-author papers written by Brajen?
Brajen: 2 two-author 2 three-author .
Which of the following statements is/are NECESSARILY true?
i. Chintan wrote exactly three two-author papers.
ii. Chintan wrote more single-author papers than Devon.
Chintan has 4 two-author papers in Case 1 and 3 in Case 2, and has fewer singles than Devon in Case 1. Neither statement must hold.
Which of the following statements is/are NECESSARILY true?
i. Arman wrote three-author papers only with Chintan and Devon.
ii. Brajen wrote three-author papers only with Chintan and Devon.
The three-author papers are and two copies of . Both statements are true.
If Devon wrote more than one two-author papers, then how many two-author papers did Chintan write?
Devon has more than one two-author paper only in Case 2, where Chintan has .
The Sustainability Index (SI) of a country at a point in time is an integer between 1 and 100. This question is related to SI of six countries - A, B, C, D, E, and F - at three different points in time - 2016, 2020, and 2024. The plot represents the exact changes in their SI, with X-coordinate representing % increase in 2020 from 2016, i.e., (SI in 2020 minus SI in 2016) / (SI in 2016), and Y-coordinate representing % increase in 2024 from 2020. At any point in time, the country with highest SI is ranked 1, while the country with the lowest SI is ranked 6. The following additional facts are known.
1. In 2016, B, C, E, and A had ranks 1, 2, 3, and 4 respectively.
2. F had lower SI than any other country in 2016, 2020, and 2024.
3. In 2024, E was the only country with SI of 90.
4. The range of SI of the six countries was 60 in 2016 as well as in 2024.
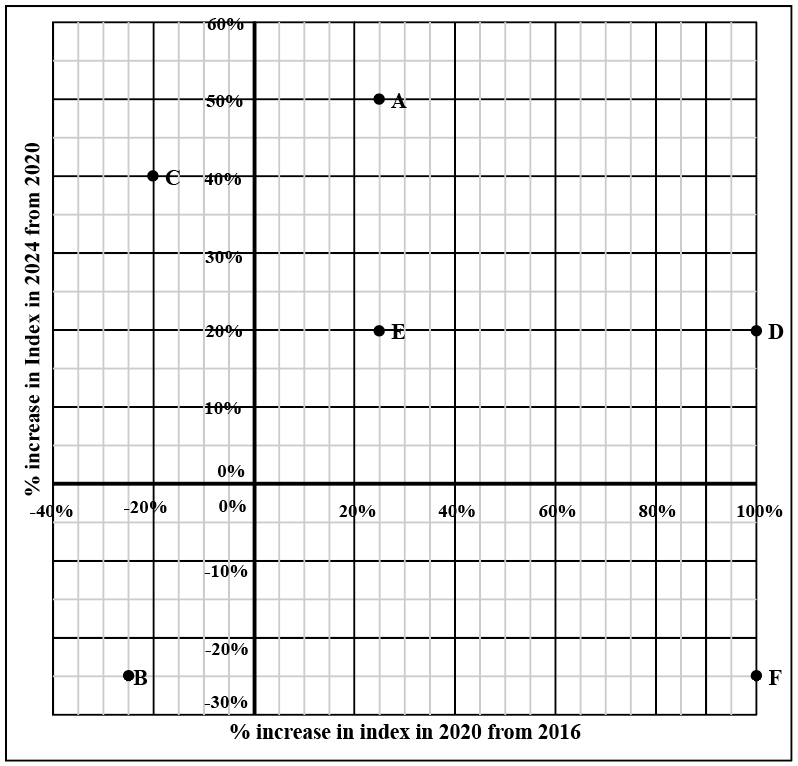
From the plot (2016→2020, 2020→2024): A (+25%, +50%), B (−25%, −25%), C (−20%, +40%), D (+100%, +20%), E (+25%, +20%), F (+100%, −25%).
E: .
All SIs are integers. B needs to be a multiple of 16, and C a multiple of 25. C (rank 2) lies between 60 and B, so C = 75 and B is 80 or 96.
2016 range 60: F = B − 60 = 20 or 36. F's 2024 value , and 2024's range is 60 with a maximum of at most 100, so F = 20 (2024: 30, max 90 = E).
So B = 80, C = 75, F = 20 in 2016.
What was the SI of E in 2016?
E in 2016 .
What was the SI of F in 2020?
F in 2020 .
What was the SI of C in 2024?
C in 2024 .
What was the SI of B in 2024?
B in 2024 .
Anirbid, Chandranath, Koushik, and Suranjan participated in a puzzle solving competition. The competition comprised 10 puzzles that had to be solved in the same sequence, i.e., a competitor got access to a puzzle as soon as they solved the previous puzzle. Some of the puzzles were visual puzzles and the others were number-based puzzles. The winner of the competition was the one who solved all puzzles in the least time.
The following charts describe their progress in the competition. The chart on the left shows the number of puzzles solved by each competitor at a given time (in minutes) after the start of the competition. The chart on the right shows the number of visual puzzles solved by each competitor at a given time (in minutes) after the start of the competition.
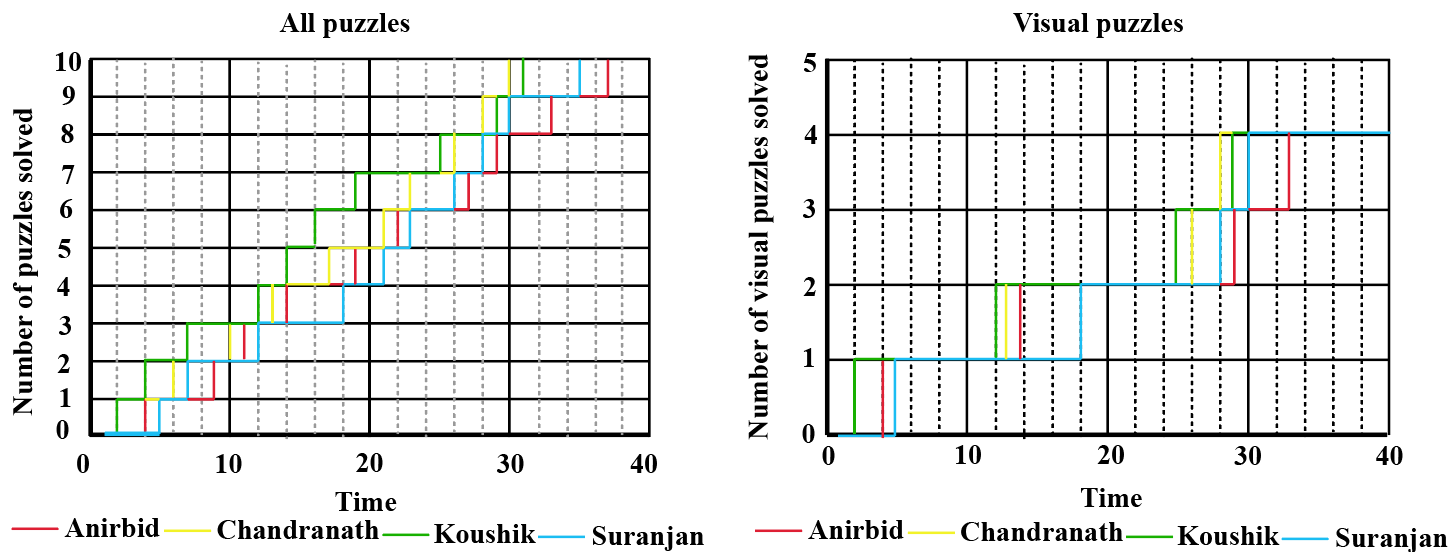
Visual puzzles are the ones whose solve times show up as steps in the right chart. Suranjan's visual steps (5, 18, 28, 30 min) match his 1st, 4th, 8th and 9th solves.
So puzzles 1, 4, 8 and 9 are visual; 2, 3, 5, 6, 7 and 10 are number-based.
Anirbid solved puzzles at about 4, 9, 11, 14, 19, 22, 27, 29, 33 and 37 minutes.
Who had solved the largest number of puzzles by the 20-th minute from the start of the competition?
At 20 minutes Koushik had solved 7, more than anyone else.
How many minutes did Suranjan take to solve the third visual puzzle in the competition?
Suranjan's third visual puzzle is puzzle 8, solved at 28 min after puzzle 7 at 26 min: minutes.
At what number in the sequence was the fourth number-based puzzle?
Number-based puzzles: 2, 3, 5, 6, … The fourth is puzzle .
Which of the following is the closest to the average time taken by Anirbid to solve the number-based puzzles in the competition?
Anirbid's number puzzles: P2 , P3 , P5 , P6 , P7 , P10 minutes.
Average minutes.
The chart below shows the price data for seven shares - A, B, C, D, E, F, and G as a candlestick plot for a particular day. The vertical axis shows the price of the share in rupees. A share whose closing price (price at the end of the day) is more than its opening price (price at the start of the day) is called a bullish share; otherwise, it is called a bearish share. All bullish and bearish shares are shown in green and red colour respectively.
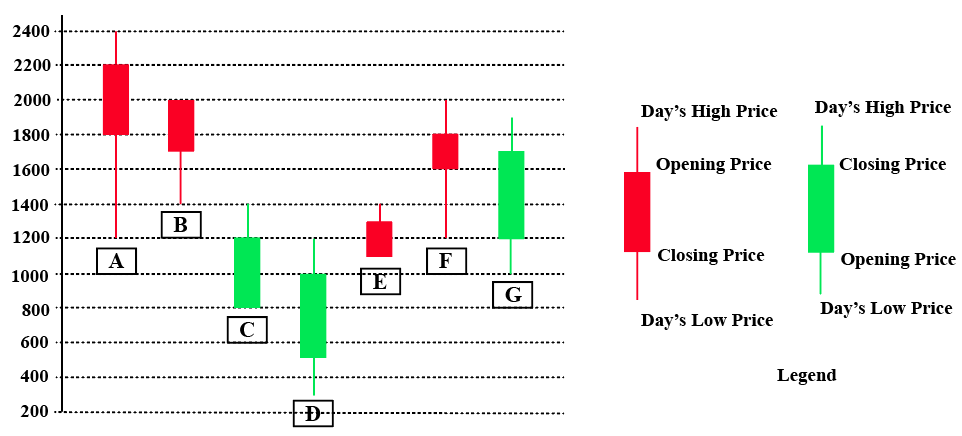
Readings (open, close, high, low):
| Share | Open | Close | High | Low | Type |
|---|---|---|---|---|---|
| A | 2200 | 1800 | 2400 | 1200 | Bearish |
| B | 2000 | 1700 | 2000 | 1400 | Bearish |
| C | 800 | 1200 | 1400 | 800 | Bullish |
| D | 500 | 1000 | 1200 | 300 | Bullish |
| E | 1300 | 1100 | 1400 | 1100 | Bearish |
| F | 1800 | 1600 | 2000 | 1200 | Bearish |
| G | 1200 | 1700 | 1900 | 1000 | Bullish |
SPV : A 0.60, B 0.32, C 0.60, D 1.20, E 0.25, F 0.47, G 0.62.
Daily Share Price Variability (SPV) is defined as (Day’s high price - Day’s low price) / (Average of the opening and closing prices during the day). Which among the shares A, C, D and F had the highest SPV on that day?
Among A, C, D and F, D has the highest SPV ().
Daily Share Price Variability (SPV) is defined as (Day’s high price - Day’s low price) / (Average of the opening and closing prices during the day). How many shares had an SPV greater than 0.5 on that day?
SPV : A, C, D, G, i.e. shares.
Daily loss for a share is defined as (Opening price - Closing price) / (Opening price). Which among the shares A, B, F and G had the highest daily loss on that day?
Loss: A , B , F ; G gained. Highest: A.
What would have been the percentage wealth gain for a trader, who bought equal numbers of all bullish shares at opening price and sold them at their day’s high?
Bullish shares C, D, G: cost , sold at highs .
Gain .
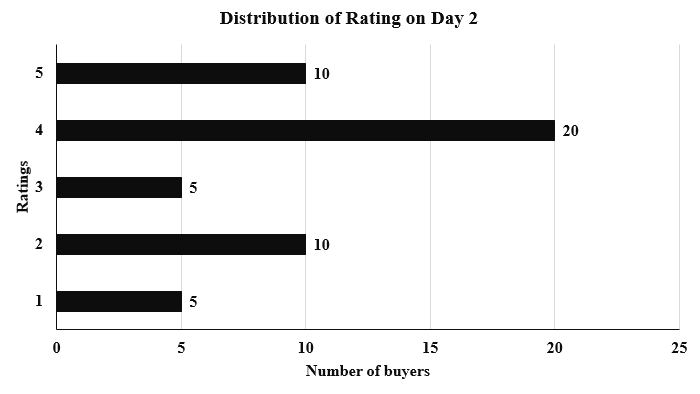
An online e-commerce firm receives daily integer product ratings from 1 through 5 given by buyers. The daily average is the average of the ratings given on that day. The cumulative average is the average of all ratings given on or before that day. The rating system began on Day 1, and the cumulative averages were 3 and 3.1 at the end of Day 1 and Day 2, respectively. The distribution of ratings on Day 2 is given in the figure below.
The following information is known about ratings on Day 3.
1. 100 buyers gave product ratings on Day 3.
2. The modes of the product ratings were 4 and 5.
3. The numbers of buyers giving each product rating are non-zero multiples of 10.
4. The same number of buyers gave product ratings of 1 and 2, and that number is half the number of buyers who gave a rating of 3.
Day 2: 50 buyers with total .
Day 1: (total 450).
Day 3: ratings 1 and 2 have buyers each, rating 3 has , and the modes 4 and 5 have each, with . , so , .
Counts: 10, 10, 20, 30, 30. Total .
How many buyers gave ratings on Day 1?
.
What is the daily average rating of Day 3?
.
What is the median of all ratings given on Day 3?
Cumulative counts: 10, 20, 40, 70, 100. The 50th and 51st ratings are both 4: median .
Which of the following is true about the cumulative average ratings of Day 2 and Day 3?
Cumulative average after Day 3 , up from 3.1, i.e. between 5% and 8%.
The two plots below give the following information about six firms A, B, C, D, E, and F for 2019 and 2023.
PAT: The firm’s profits after taxes in Rs. crores,
ES: The firm’s employee strength, that is the number of employees in the firm, and
PRD: The percentage of the firm’s PAT that they spend on Research and Development (R&D).
In the plots, the horizontal and vertical coordinates of point representing each firm gives their ES and PAT values respectively. The PRD values of each firm are proportional to the areas around the points representing each firm. The areas are comparable between the two plots, i.e., equal areas in the two plots represent the same PRD values for the two years.
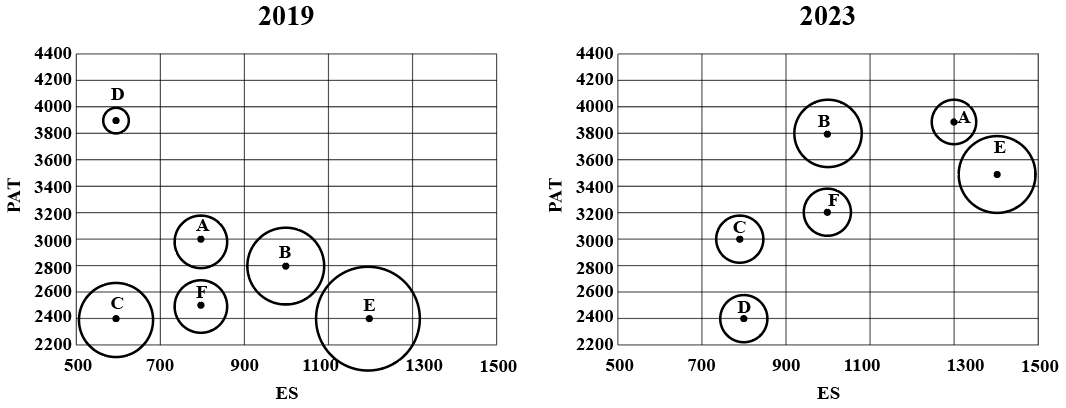
Read (ES, PAT) from the plots.
2019: A (800, 3000), B (1000, 2800), C (600, 2400), D (600, 3900), E (1200, 2400), F (800, 2500).
2023: A (1300, 3900), B (1000, 3800), C (800, 3000), D (800, 2400), E (1400, 3500), F (1000, 3200).
R&D spend PAT PRD, where PRD is proportional to the circle's area.
Assume that the annual rate of growth in PAT over the previous year (ARG) remained constant over the years for each of the six firms. Which among the firms A, B, C, and E had the highest ARG?
Growth 2019→2023: A , B , C , E . Highest: E.
The ratio of the amount of money spent by Firm C on R&D in 2019 to that in 2023 is closest to
C's circle shrinks from radius about 3 to about 2 grid units, so PRD falls in the ratio .
R&D ratio , i.e. .
Which among the firms A, C, E, and F had the maximum PAT per employee in 2023?
PAT per employee in 2023: A 3.0, C 3.75, E 2.5, F 3.2. Highest: C.
Which among the firms C, D, E, and F had the least amount of R&D spending per employee in 2023?
C and D have equal-sized circles and the same ES, but D's PAT is lower (2400 vs 3000). E and F have larger circles and higher PAT per employee. Least: D.
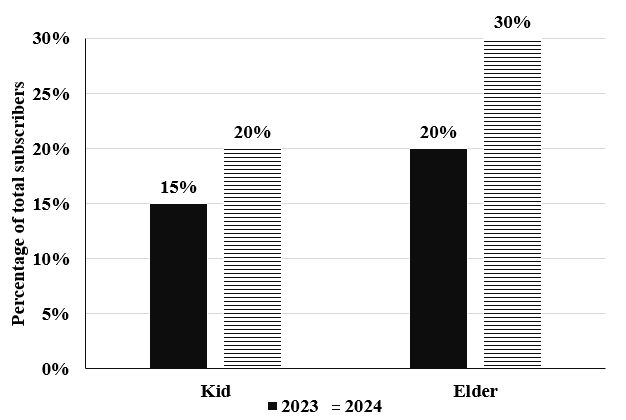
Over the top (OTT) subscribers of a platform are segregated into three categories: i) Kid, ii)Elder, and iii) Others. Some of the subscribers used one app and the others used multiple apps to access the platform. The figure below shows the percentage of the total number of subscribers in 2023 and 2024 who belong to the ‘Kid’ and ‘Elder’ categories.
The following additional facts are known about the numbers of subscribers.
1. The total number of subscribers increased by 10% from 2023 to 2024.
2. In 2024, 1/2 of the subscribers from the ‘Kid’ category and 2/3 of the subscribers from the ‘Elder’ category subscribers use one app.
3. In 2023, the number of subscribers from the ‘Kid’ category who used multiple apps was the same as the number of subscribers from the ‘Elder’ category who used one app.
4. 10,000 subscribers from the ‘Kid’ category used one app and 15,000 subscribers from the ‘Elder’ category used multiple apps in 2023.
Let the 2023 total be (2024: ). Kid: 15% (2023), 20% (2024). Elder: 20%, 30%.
2023: Kid one-app and Elder multi-app . Kid multi-app Elder one-app .
and , .
2024 total : Kid 22000, Elder 33000, Others 55000.
How many subscribers belonged to the ‘Others’ category in 2024?
Others in 2024 of 110000 .
What percentage of subscribers in the ‘Kid’ category used multiple apps in 2023?
Kid 2023 , of which 5000 used multiple apps: .
What was the percentage increase in the number of subscribers in the ‘Elder’ categoryfrom 2023 to 2024?
Elder: 20000 → 33000, an increase of .
What could be the minimum percentage of subscribers who used multiple apps in 2024?
2024 multi-app: Kid , Elder ; Others could all use one app.
Minimum .
The two plots below show data for four companies code-named A, B, C, and D over three years - 2019, 2020, and 2021.
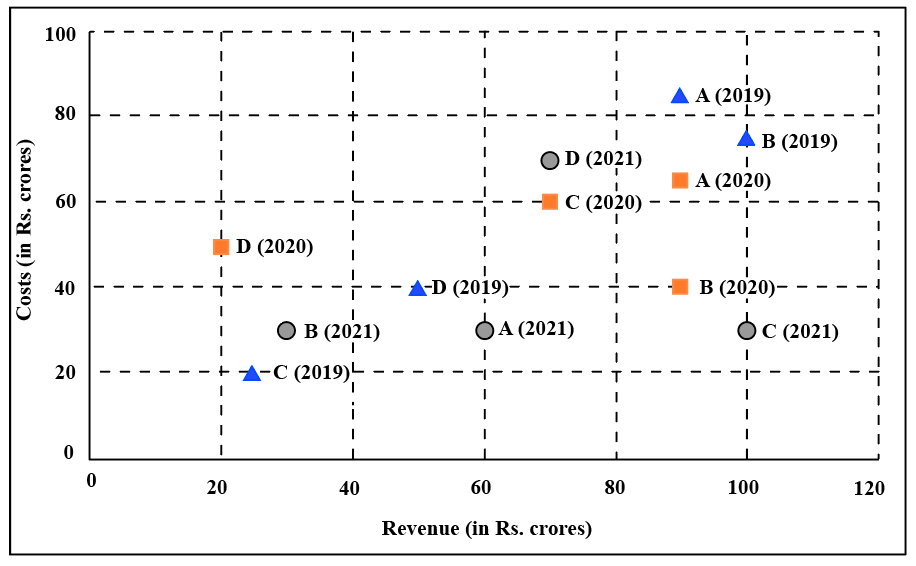
The first plot shows the revenues and costs incurred by the companies during these years. For example, in 2021, company C earned Rs.100 crores in revenue and spent Rs.30 crores. The profit of a company is defined as its revenue minus its costs
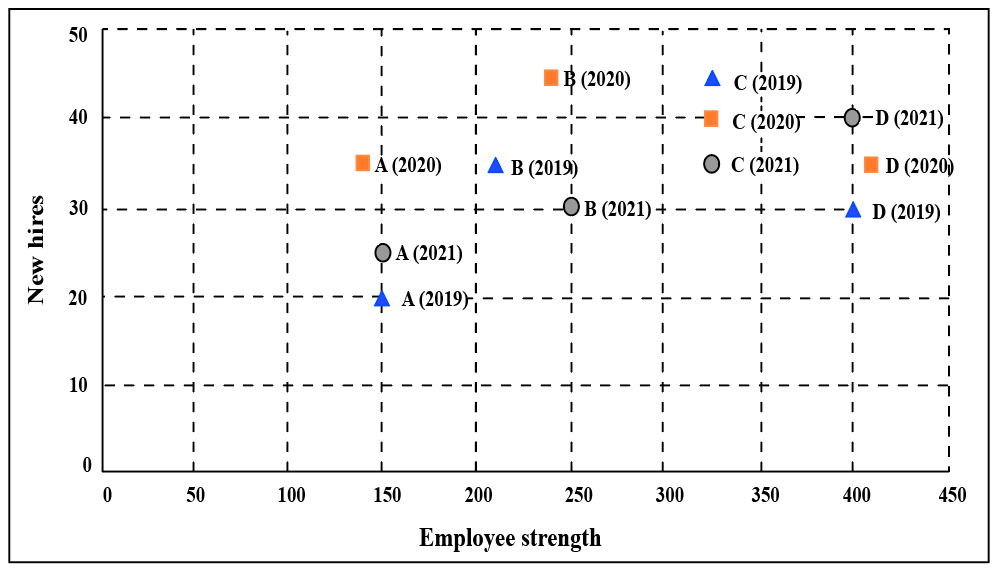
The second plot shows the number of employees employed by the company (employee strength) at the start of each of these three years, as well as the number of new employees hired each year (new hires). For example, Company B had 250 employees at the start of 2021, and 30 new employees joined the company during the year.
Profit revenue cost (Rs. crore), read from the first plot:
| Company | 2019 | 2020 | 2021 |
|---|---|---|---|
| A | |||
| B | |||
| C | |||
| D |
Employees (start of year, new hires) from the second plot:
| Company | 2019 | 2020 | 2021 |
|---|---|---|---|
| A | 150, 20 | 140, 35 | 150, 25 |
| B | 210, 35 | 240, 45 | 250, 30 |
| C | 325, 45 | 325, 40 | 325, 35 |
| D | 400, 30 | 410, 35 | 400, 40 |
Employees lost in a year start hires next year's start.
Considering all three years, which company had the highest annual profit?
Highest single-year profit: C in 2021, Rs. 70 crore.
Which of the four companies experienced the highest annual loss in any of the years?
The only loss: D in 2020, Rs. 30 crore.
The ratio of a company's annual profit to its annual costs is a measure of its performance. Which of the four companies had the lowest value of this ratio in 2019?
2019 profit/cost: A , B , C , D . Lowest: A.
The total number of employees lost in 2019 and 2020 was the least for:
Lost in 2019 + 2020: A , B , C , D . Least: B.
Profit per employee is the ratio of a company's profit to its employee strength. For this purpose, the employee strength in a year is the average of the employee strength at the beginning of that year and the beginning of the next year. In 2020, which of the four companies had the highest profit per employee?
2020 average strength: A 145, B 245, C 325, D 405.
Profit per employee: A , B , C , D negative. Highest: B.
In the following, a year corresponds to 1st of January of that year.
A study to determine the mortality rate for a disease began in 1980. The study chose 1000 males and 1000 females and followed them for forty years or until they died, whichever came first. The 1000 males chosen in 1980 consisted of 250 each of ages 10 to less than 20, 20 to less than 30, 30 to less than 40, and 40 to less than 50. The 1000 females chosen in 1980 also consisted of 250 each of ages 10 to less than 20, 20 to less than 30, 30 to less than 40,and 40 to less than 50.
The four figures below depict the age profile of those among the 2000 individuals who were still alive in 1990, 2000, 2010, and 2020. The blue bars in each figure represent the number of males in each age group at that point in time, while the pink bars represent the number of females in each age group at that point in time. The numbers next to the bars give the exact numbers being represented by the bars. For example, we know that 230 males among those tracked and who were alive in 1990 were aged between 20 and 30.
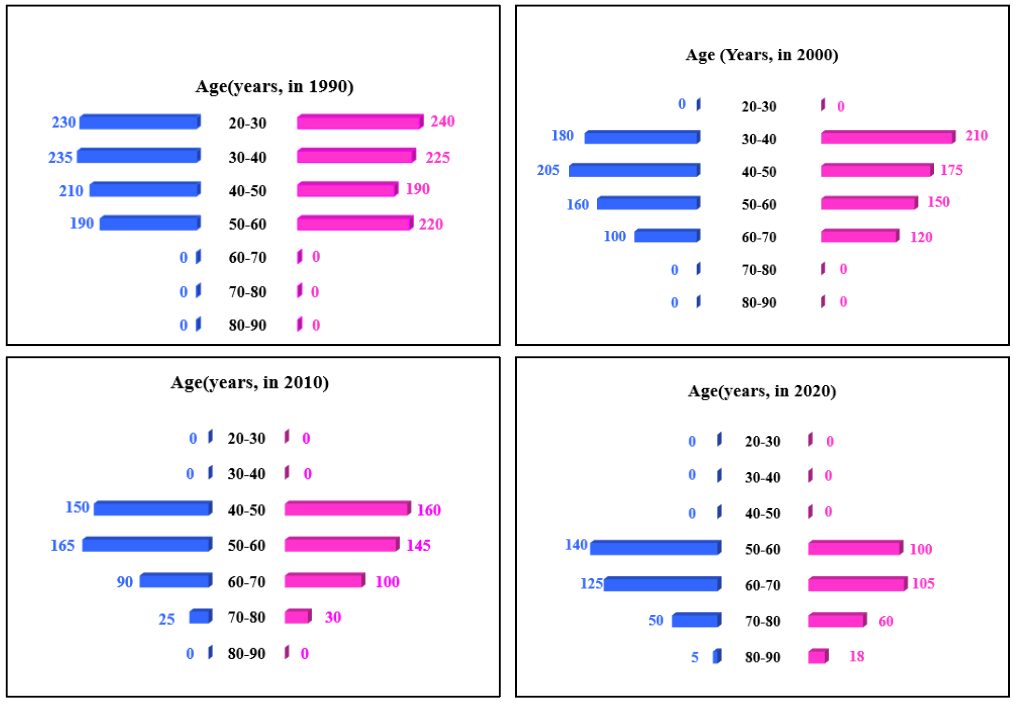
Group people by their 1980 age band (250 men and 250 women in each). Every 10 years a band moves up one age group, so each bar can be traced to its 1980 band.
Survivors (Males, Females):
| 1980 band | 1990 | 2000 | 2010 | 2020 |
|---|---|---|---|---|
| 10–20 | 230, 240 | 180, 210 | 150, 160 | 140, 100 |
| 20–30 | 235, 225 | 205, 175 | 165, 145 | 125, 105 |
| 30–40 | 210, 190 | 160, 150 | 90, 100 | 50, 60 |
| 40–50 | 190, 220 | 100, 120 | 25, 30 | 5, 18 |
In 2000, what was the ratio of the number of dead males to dead females among those being tracked?
Alive in 2000: males , females .
Dead: .
How many people who were being tracked and who were between 30 and 40 years of age in 1980 survived until 2010?
The 30–40 band in 2010: .
How many individuals who were being tracked and who were less than 30 years of age in 1980 survived until 2020?
The 10–20 and 20–30 bands in 2020: .
How many of the males who were being tracked and who were between 20 and 30 years of age in 1980 died in the period 2000 to 2010?
Males of the 20–30 band: (2000) (2010) .
How many of the females who were being tracked and who were between 20 and 30 years of age in 1980 died between the ages of 50 and 60?
This band was 50–60 years old from 2000 to 2010 (40–50 group in 2000, 50–60 group in 2010). Females who died: .
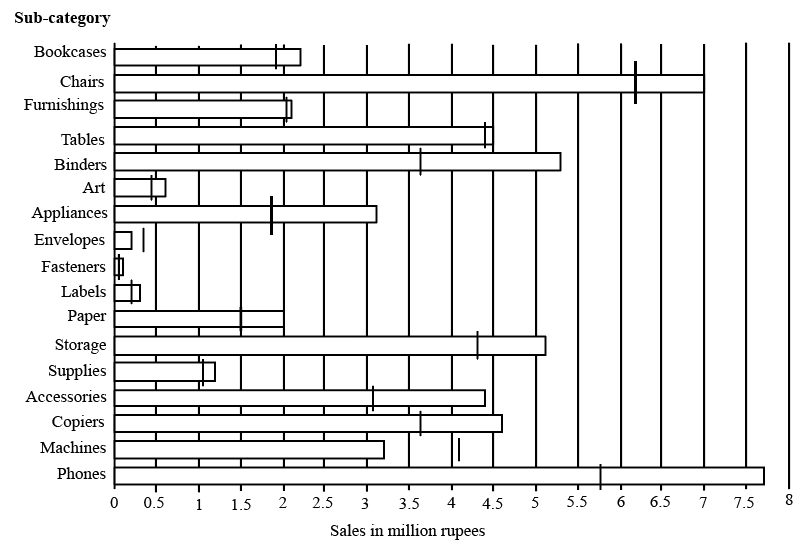
The horizontal bars in the above diagram represent 2020 aggregate sales (in ₹ million) of a company for the different subcategories of its products. The top four product subcategories (Bookcases, Chairs, Furnishings, Tables) belong to furniture product category; the bottom four product subcategories (Accessories, Copiers, Machines, Phones) belong to the technology product category while all other product subcategories belong to the office supply product category. For each of the product subcategories, there is a vertical line indicating the sales of the corresponding subcategory in 2019.
Approximate readings (₹ million), 2019 → 2020:
| Category | Subcategory | 2019 | 2020 |
|---|---|---|---|
| Furniture | Bookcases | 1.9 | 2.2 |
| Furniture | Chairs | 6.2 | 7.0 |
| Furniture | Furnishings | 2.0 | 2.1 |
| Furniture | Tables | 4.4 | 4.5 |
| Office | Binders | 3.65 | 5.3 |
| Office | Art | 0.45 | 0.6 |
| Office | Appliances | 1.85 | 3.1 |
| Office | Envelopes | 0.35 | 0.2 |
| Office | Fasteners | 0.05 | 0.1 |
| Office | Labels | 0.2 | 0.3 |
| Office | Paper | 1.5 | 2.0 |
| Office | Storage | 4.3 | 5.1 |
| Office | Supplies | 1.05 | 1.2 |
| Technology | Accessories | 3.1 | 4.4 |
| Technology | Copiers | 3.65 | 4.6 |
| Technology | Machines | 4.1 | 3.2 |
| Technology | Phones | 5.75 | 7.7 |
The total sales (in ₹ million) in 2019 from products in office supplies category is closest to
, closest to 13.5.
The percentage increase in sales in Furniture category from 2019 to 2020 is closest to
Furniture: , about ; closest option 8%.
How many subcategories had sales of ₹ 4 million or more in 2019 and registered an increase in sales in excess of 25% in 2020?
2019 sales : Chairs (+13%), Tables (+2%), Storage (+19%), Machines (fell), Phones (+34%). Only .
The improvement index for a category is the maximum percentage increase in sales from 2019 to 2020 among any of its subcategories. The correct order of categories in increasing order of this improvement index is
Largest increase: Furniture, Bookcases . Technology, Accessories . Office supply, Fasteners . Increasing order: furniture, technology, office supply.
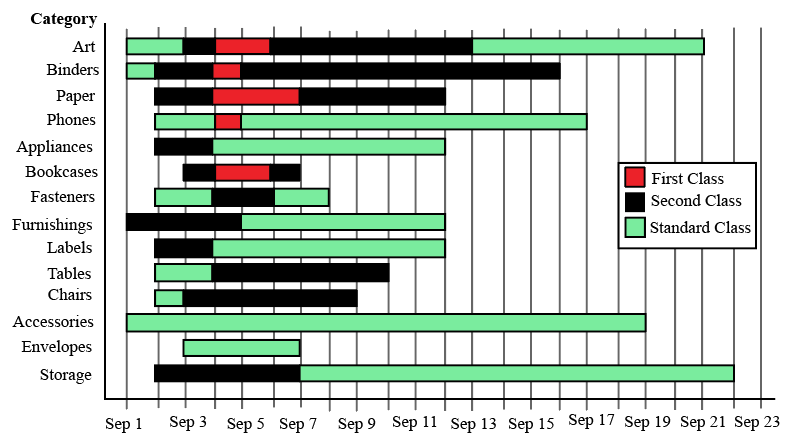
The different bars in the diagram above provide information about different orders in various categories (Art, Binders, ….) that were booked in the first two weeks of September of a store for one client. The colour and pattern of a bar denotes the ship mode (First Class / Second Class / Standard Class). The left end point of a bar indicates the booking day of the order, while the right end point indicates the dispatch day of the order. The difference between the dispatch day and the booking day (measured in terms of the number of days) is called the processing time of the order. For the same category, an order is considered for booking only after the previous order of the same category is dispatched. No two consecutive orders of the same category had identical ship mode during this period.
For example, there were only two orders in the furnishing category during this period. The first one was shipped in the Second Class. It was booked on Sep 1 and dispatched on Sep 5. The second order was shipped in the Standard class. It was booked on Sep 5 (although the order might have been placed before that) and dispatched on Sep 12. So the processing times were 4 and 7 days respectively for these orders.
Reading each bar (booking day → dispatch day, processing time):
| Category | Orders (Sep) | Times |
|---|---|---|
| Art | 1–3, 3–4, 4–6, 6–13, 13–21 | 2, 1, 2, 7, 8 |
| Binders | 1–2, 2–4, 4–5, 5–16 | 1, 2, 1, 11 |
| Paper | 2–4, 4–7, 7–12 | 2, 3, 5 |
| Phones | 2–4, 4–5, 5–17 | 2, 1, 12 |
| Appliances | 2–4, 4–12 | 2, 8 |
| Bookcases | 3–4, 4–6, 6–7 | 1, 2, 1 |
| Fasteners | 2–4, 4–6, 6–8 | 2, 2, 2 |
| Furnishings | 1–5, 5–12 | 4, 7 |
| Labels | 2–4, 4–12 | 2, 8 |
| Tables | 2–4, 4–10 | 2, 6 |
| Chairs | 2–3, 3–9 | 1, 6 |
| Accessories | 1–19 | 18 |
| Envelopes | 3–7 | 4 |
| Storage | 2–7, 7–22 | 5, 15 |
Total orders: 35.
How many days between Sep 1 and Sep 14 (both inclusive) had no booking from this client considering all the above categories?
Booking days: Sep 1–7 and Sep 13. No booking on Sep 8, 9, 10, 11, 12, 14: days.
What was the average processing time of all orders in the categories which had only one type of ship mode?
Single ship mode: Accessories (18) and Envelopes (4). Average .
The sequence of categories -- Art, Binders, Paper and Phones -- in decreasing order of average processing time of their orders in this period is:
Averages: Phones , Art , Binders , Paper .
Approximately what percentage of orders had a processing time of one day during the period Sep 1 to Sep 22 (both dates inclusive)?
One-day orders: Art 1, Binders 2, Phones 1, Bookcases 2, Chairs 1 . .
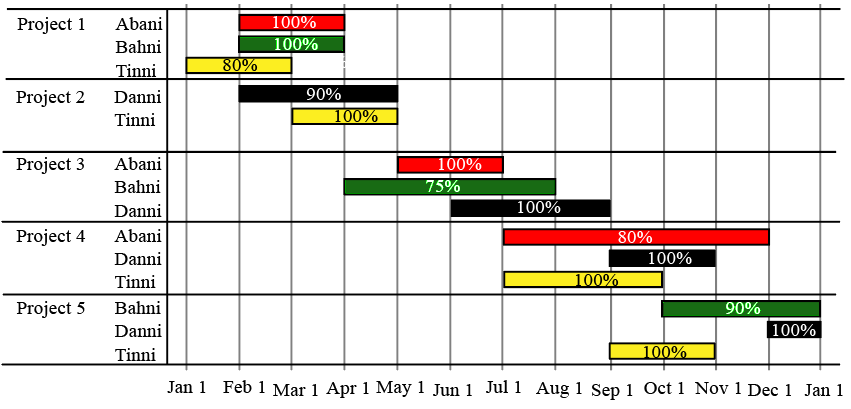
The figure above shows the schedule of four employees - Abani, Bahni, Danni, and Tinni - whom Dhoni supervised in 2020. Altogether there were five projects which started and concluded in 2020 in which they were involved. For each of these projects and for each employee, the starting day was at the beginning of a month and the concluding day was the end of a month, and these are indicated by the left and right end points of the corresponding horizontal bars. The number within each bar indicates the percentage of assigned work completed by the employee for that project, as assessed by Dhoni.
For each employee, his/her total project-month (in 2020) is the sum of the number of months (s)he worked across the five projects, while his/her annual completion index is the weightage average of the completion percentage assigned from the different projects, with the weights being the corresponding number of months (s)he worked in these projects. For each project, the total employee-month is the sum of the number of months four employees worked in this project, while its completion index is the weightage average of the completion percentage assigned for the employees who worked in this project, with the weights being the corresponding number of months they worked in this project.
Reading the bars (months, completion %):
| Project | Abani | Bahni | Danni | Tinni |
|---|---|---|---|---|
| 1 | Feb–Mar (2, 100) | Feb–Mar (2, 100) | – | Jan–Feb (2, 80) |
| 2 | – | – | Feb–Apr (3, 90) | Mar–Apr (2, 100) |
| 3 | May–Jun (2, 100) | Apr–Jul (4, 75) | Jun–Aug (3, 100) | – |
| 4 | Jul–Nov (5, 80) | – | Sep–Oct (2, 100) | Jul–Sep (3, 100) |
| 5 | – | Oct–Dec (3, 90) | Dec (1, 100) | Sep–Oct (2, 100) |
Which of the following statements is/are true?
I: The total project-month was the same for the four employees.
II: The total employee-month was the same for the five projects.
Project-months: every employee has 9. Employee-months: P1 6, P2 5, P3 9, P4 10, P5 6. Only I.
Which employees did not work in multiple projects for any of the months in 2020?
Tinni works on Projects 4 and 5 in September. Abani, Bahni and Danni never overlap.
The project duration, measured in terms of the number of months, is the time during which at least one employee worked in the project. Which of the following pairs of the projects had the same duration?
Durations: P1 Jan–Mar 3, P2 Feb–Apr 3, P3 Apr–Aug 5, P4 Jul–Nov 5, P5 Sep–Dec 4. Projects 3 and 4 (also 1 and 2).
The list of employees in decreasing order of annual completion index is:
Danni ; Tinni ; Abani ; Bahni .
Preparing for CAT seriously? Structured courses, live classes and mocks by Dr. Kiran Derle at Target Campus.
Explore courses ↗